


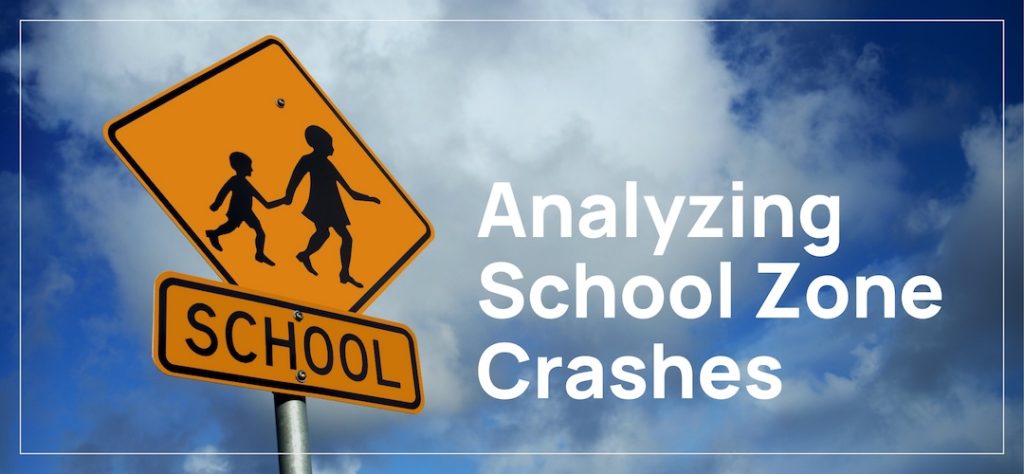
The Dallas-Fort Worth metropolitan area is home to more than 8 million people and experienced the fastest numeric population growth of any metropolitan region in the United States from 2022 to 2023. As the region continues to grow, so does the amount of traffic moving through Dallas, Tarrant, Collin, and Denton counties. That raises important questions about safety during everyday commutes, especially the twice-daily school drop-offs and pickups that millions of families rely on.
The conversation surrounding school road safety in Dallas-Fort Worth is unique, as North Texas has faced its own challenges with declining student enrollment despite an overall population growth in the area. This has left some schools under capacity, while others have closed altogether, consolidated with neighboring campuses, or announced plans to do so.
While school traffic safety may receive considerable attention from parents and school officials, there has not been a comprehensive examination of crash patterns near schools across the entire Dallas-Fort Worth metroplex. This gap in understanding motivated our decision to analyze traffic incidents around public and charter schools throughout the four-county region.
In partnership with iLawyerMarketing, GreeningLaw examined three years of crash data from the Texas Department of Transportation, covering the period from 2022 through 2024. We focused specifically on crashes that occurred within a quarter-mile of school campuses during school hours and throughout the regular academic year.
Using school information that we obtained from the Texas Education Agency, we analyzed 1,405 schools, limiting our analysis to regular instruction schools with enrollment above 50 students, and identified 12,713 crashes that took place near these campuses.
Our primary goal was to determine which schools experience the highest number of traffic incidents in their surrounding areas, with additional details on crash outcomes. This study aims to provide valuable information for parents, school administrators, and anyone who is working to improve student safety.
Key Takeaways:
- Dr. Wright L. Lassiter Jr. Early College High School had the highest three-year crash count in the Dallas-Fort Worth metroplex.
- While W.W. Samuell High School ranked 31st overall for crash count, it was the school with the most student-aged crash victims at 151 over the study period.
- Trimble Technical High School in Fort Worth was the high school with the most student drivers who experienced a crash near campus.
Which Schools See the Most Crashes?
The table below highlights the schools with the highest number of nearby crashes, along with details such as injury and fatality counts, pedestrian-involved incidents, and the number of student-aged individuals involved in crashes.
Student-aged crash victims were estimated based on the typical age range for the grade levels each school serves. Because not all crashes include complete person-level data, these figures reflect minimum counts based on the available information.
Most of the schools at the top of the list are located in Dallas and Fort Worth. These are busy urban areas where streets around schools often see a lot of traffic throughout the day. Dr. Wright L. Lassiter Jr. Early College High School had the highest total, with 223 crashes nearby, including 117 that caused injuries and 17 that involved a pedestrian.
Pedestrian crashes appeared across several schools on the list. While most crashes involved vehicles only, some schools had five, 10, or even more pedestrian-involved crashes. These are especially concerning given that students often walk to and from school, or cross busy streets during pick-up and drop-off.
The interactive map below displays the 50 most crash-prone schools in the metroplex. Zoom in and hover over each point for more details.
Where are High School Drivers Most at Risk?
This table focuses specifically on high schools to identify where student drivers face the highest crash risk near campus. Schools are ranked by the number of crashes involving student drivers, with an additional column showing the total number of crash victims within the high school age range.
Trimble Technical High School in Fort Worth tops the list, with 22 student drivers involved in crashes and 49 total high school-aged victims. The school also appeared in our earlier table for overall crash volume, ranking 16th. This may suggest that the roads around the campus are difficult for younger drivers to navigate.
Plano East Senior High School and Boswell High School also had a relatively high number of student drivers involved in crashes over the study period. Both campuses serve large student populations and are located in busy suburban areas where driving to school is common and traffic activity remains high.
A Look at 1,405 Schools Across Four Counties
Use the interactive map below to search hundreds of schools across Dallas, Tarrant, Collin, and Denton counties and see how many crashes occurred within a quarter mile, including the number of injuries, fatalities, and pedestrian-involved incidents.
The map includes all 1,405 regular-instruction schools with enrollment above 50 students that had at least one crash within a three-year period. Each dot represents a school included in our analysis.
What Can be Done?
Improving traffic safety near schools will require both broader policy conversations and everyday decisions made by families. While not every risk can be eliminated, there are several evidence-based strategies that can help protect students during commutes.
One factor that may get overlooked is how sleep, or the lack of it, affects crash risk. Teens are especially vulnerable here. Their sleep cycles naturally shift later, making it harder to fall asleep early and wake up early. When school starts too soon, many students end up driving while drowsy, rushed, or unfocused.
In one study of teen drivers in Fairfax County, Virginia, crash rates among 16- to 18-year-olds dropped from 31.6 to 29.6 per 1,000 licensed drivers after the district delayed high school start times by just 50 minutes. The rest of the state, where start times didn’t change, saw no similar drop. These findings suggest that even modest changes to school schedules can lead to real safety gains.
Even without systemic changes, parents and students can take simple but impactful steps. Getting enough sleep and waking up with extra time to spare can reduce the likelihood of rushed or frustrated driving, which often leads to drivers to take riskier actions.
If available, families may also want to consider opting for school-provided transportation. School buses are consistently shown to be the safest method for students to travel to and from school. Their large size, reinforced structures, and design standards help protect passengers in the event of a collision. Though seat belts on buses remain a point of debate in some states, the overall safety record of school buses far exceeds that of passenger vehicles, especially when it comes to student fatalities.
Awareness is also critical to support a safer environment. Parents can talk with their children about safer habits behind the wheel or while walking near traffic. School leaders can work with city planners or local transportation departments to assess whether intersections, signage, or pick-up zones are working as intended. Small changes, when multiplied across hundreds of campuses and thousands of families, can add up.
As North Texas continues to grow and student enrollments continue to shift, these conversations become even more important. The findings in this report are intended to inform conversations about school commute safety and help guide local decision-making.
Methodology
We compiled a list of all schools located in Dallas, Tarrant, Collin, and Denton counties using the Texas Education Agency’s Public Open Data site. Schools were included only if they were listed as active in the dataset, which reflects records updated through March 2025. Our analysis focused exclusively on schools classified as regular instruction campuses. Schools categorized as alternative education or Juvenile Justice Alternative Education Programs (JJAEP) were excluded, as were campuses with fewer than 50 enrolled students. Additionally, schools sharing the same campus address were consolidated into a single entry. After applying these criteria, we identified 1,405 schools for inclusion in the study.
To identify crashes near schools, we set a 0.25-mile radius around each school’s official address. Any crash occurring within this buffer zone was considered a “nearby school crash.” Excluded any school that had 0 crashes in 3 years.
Crash data was obtained from the Texas Department of Transportation, covering the years 2022 through 2024. We excluded crashes occurring during the summer months of June and July to focus on the traditional school calendar. Additionally, only crashes that occurred between 6:30 a.m. and 6:30 p.m. were included, aligning with typical school-day hours. Highway-related crashes were also excluded from the analysis. Injury count was used as a tie-breaker in our rankings.
All findings are based on available data. As such, some schools or crashes with missing or incomplete information may not be fully represented in the results.
Fair Use Statement
If you find this research valuable, we encourage you to share it. When referencing any of our findings, please include a link back to the original source so others can access the complete data and analysis.